azure-data-pipeline
End-to-End Data Engineering Solution
This documentation outlines an end-to-end data engineering project that streamlines data processing and visualization through the following steps:
- Data Import: Import data into on-premise SQL Server to ensure integrity and accessibility.
- Data Transfer: Use Azure Data Factory to copy data from on-premise SQL Server to Azure Data Lake Gen2 for scalable storage.
- Data Transformation: Utilize Azure Databricks to transform raw data into a clean, structured format.
- Data Loading: Load the transformed data into Azure Synapse Analytics for efficient querying and analysis.
- Data Visualization: Create interactive dashboards using Power BI to visualize insights derived from the data.
This project integrates various cloud technologies to enhance data accessibility and empower stakeholders to make informed decisions based on real-time analytics.
1. Data Import
The dataset used in this project is one of the historical sales of supermarket company which has recorded in 3 different branches for 3 months data (available at https://www.kaggle.com/datasets/aungpyaeap/supermarket-sales).
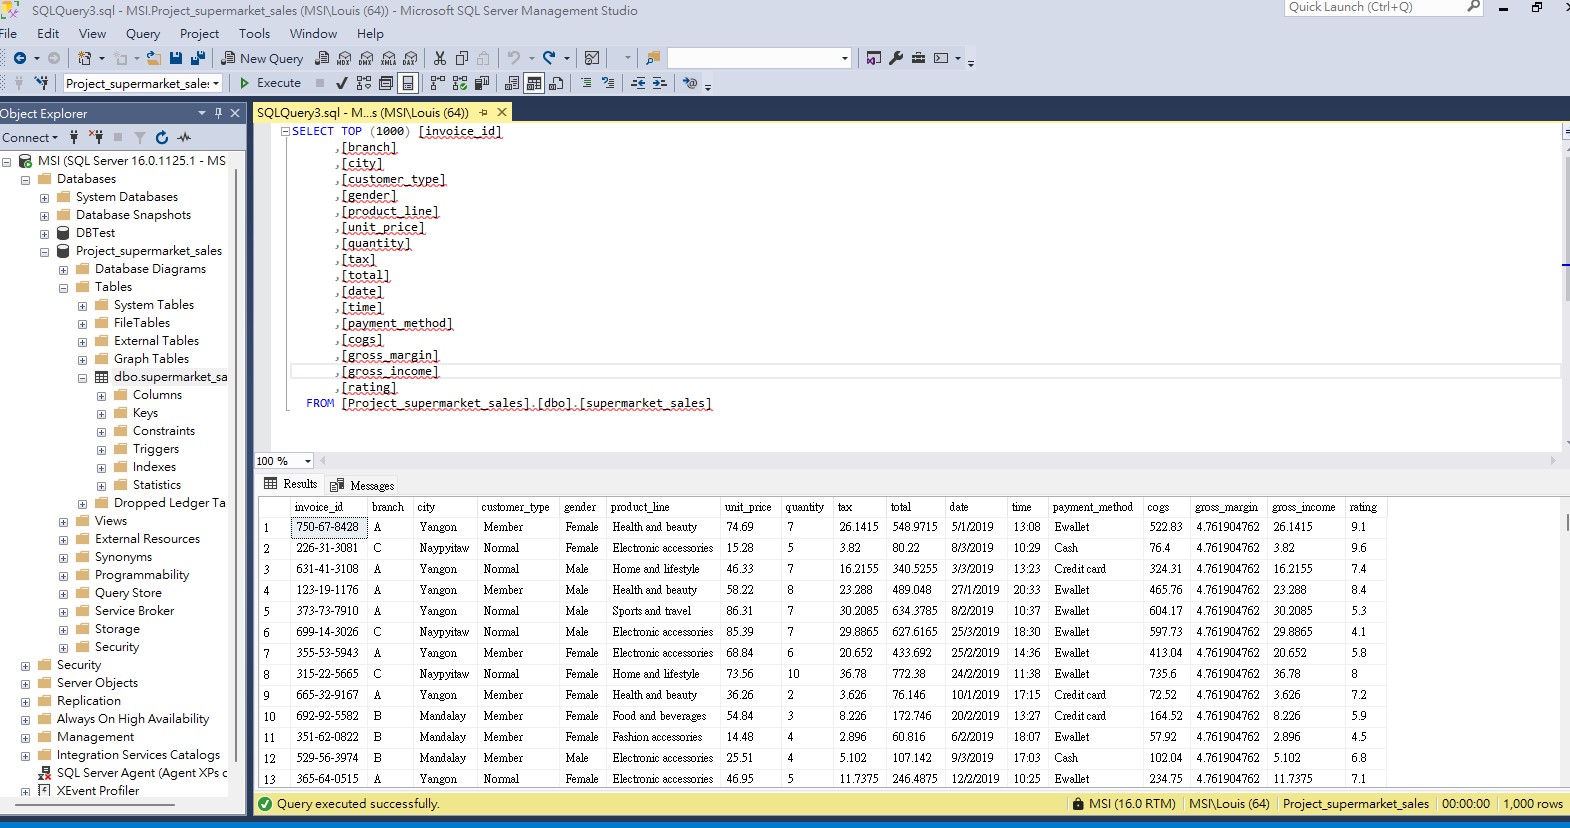
Firstly, I created a new database named “Project_supermarket_sales” on SQL Server and import the raw data into the table named “dbo.supermarket_sales”. Based on the preview of table, it is noted that the data includes the following attributes:
- invoice_id: Computer generated sales slip invoice identification number
- branch: Branch of supercenter (3 branches are available identified by A, B and C).
- city: Location of supercenters
- customer_type: Type of customers, recorded by Members for customers using member card and Normal for without member card.
- gender: Gender type of customer
- product_line: General item categorization groups - Electronic accessories, Fashion accessories, Food and beverages, Health and beauty, Home and lifestyle, Sports and travel
- unit_price: Price of each product in $
- quantity: Number of products purchased by customer
- tax: tax fee for customer buying
- total: Total price including tax
- date: Date of purchase (Record available from January 2019 to March 2019)
- time: Purchase time (10am to 9pm)
- payment: Payment used by customer for purchase (3 methods are available – Cash, Credit card and Ewallet)
- cogs: Cost of goods sold
- gross_margin: Gross margin percentage
- gross_income: Gross income
- rating: Customer stratification rating on their overall shopping experience (On a scale of 1 to 10)
2. Data Transfer
This sections outlines the procedure for moving the data from on-premise SQL server to my Azure storage.
2.1 Create a user in my on-premise database Project_supermarket_sales
Run the following query in sql:
CREATE USER louis with PASSWORD '********'

CREATE USER louis for login louis
Note: You may replace with your own username and password for your case.
2.2 Set up pipeline in Azure Data Factory (ADF)
Firstly create an instance of ADF on Azure Portal

Create a pipeline and insert “Copy data” activity into the pipeline.
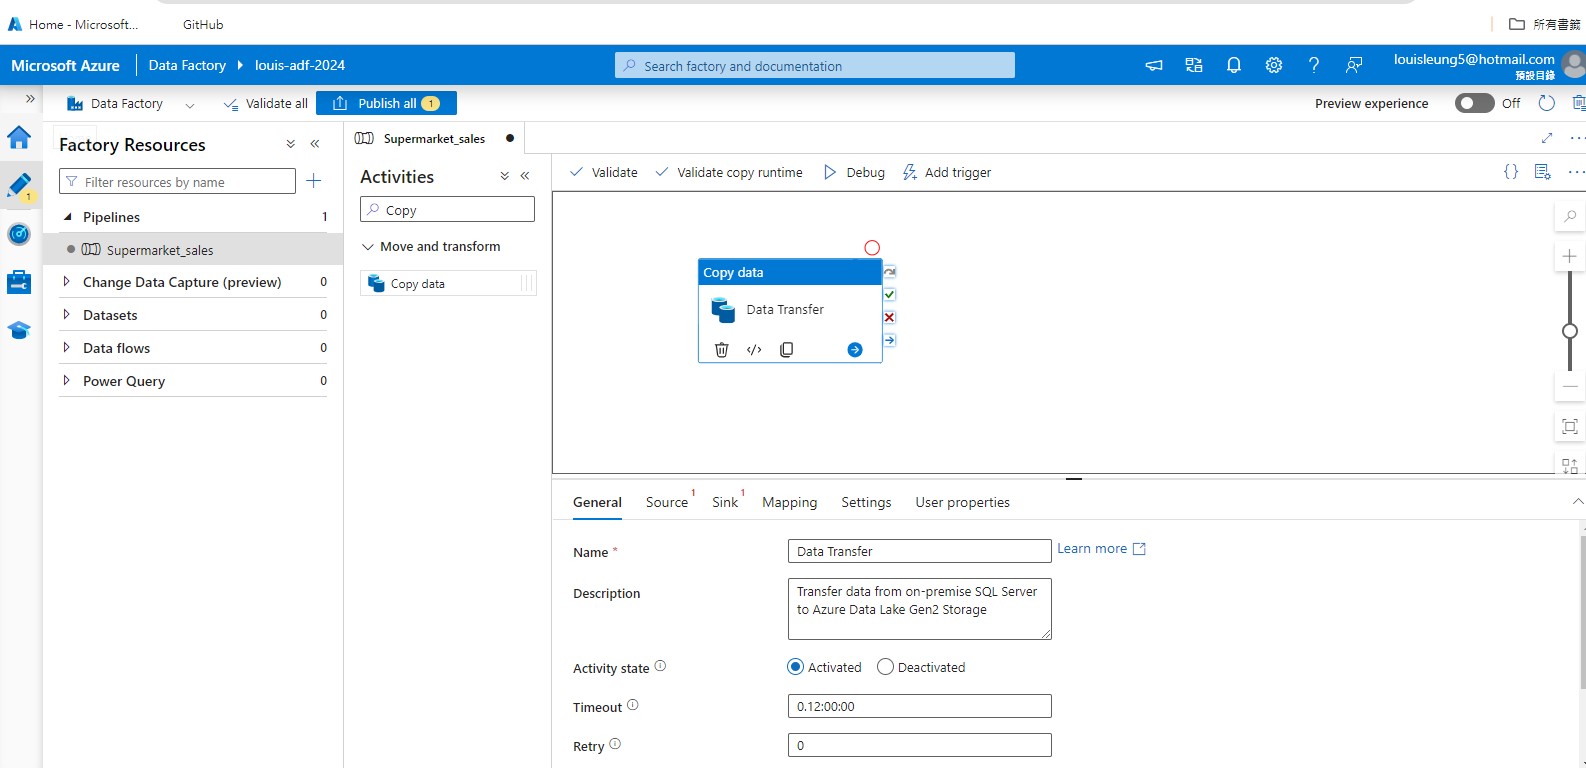
In the “Copy Data” activity, go to “Source” tab and set up a linked service to our table stored in our on-premise SQL Server.
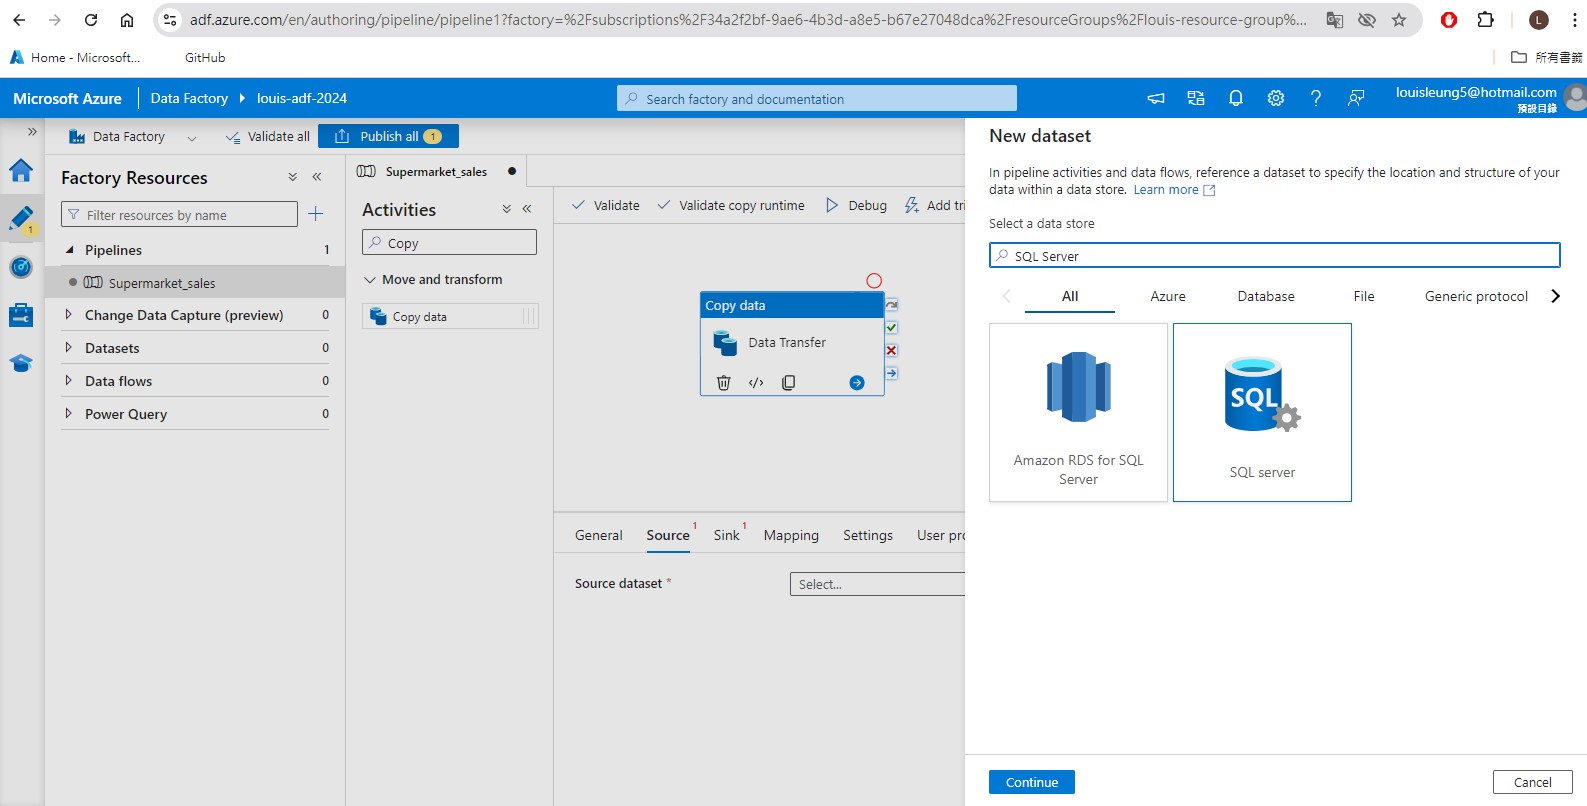
However, in order to connect our ADF to our on-premise SQL Server, we first need to create a self-hosted integration runtime. (Follow the steps and you will be asked to choose 1 of the two option to download and install the integration runtime .exe file)
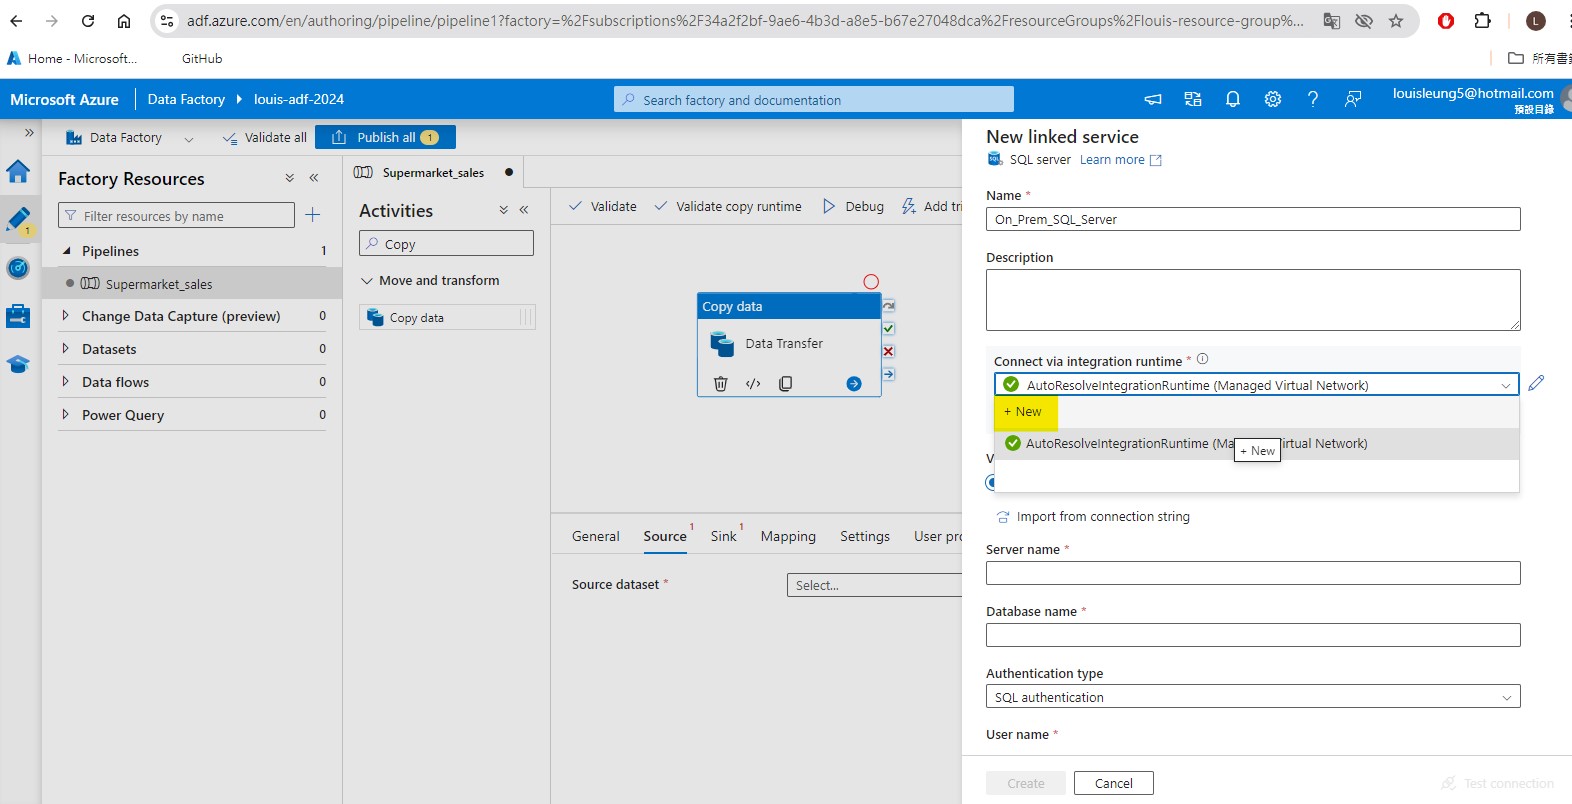
Once installing the integration runtime, it should appears as one of the option for integration runtime. Afterward, we need to fill in the details of our on-premise SQL Server table, including:
- server name: this can be found in SQL Server
- database name: this can be found in SQL Server
- Authentication type: let’s select SQL authentication here
- User name: this is the user that we create using the script (see section 2.1) in SQL
- Password: there is two options here: (i) type in the password that we used to create the user in SQL directly (ii) create a Azure Key Vault to store the password as a “secret” and link to that “secret” here. I have chosen the later here. See section 2.2.1 on how to set up Azure key vault.
.jpg)
After setting up the Source dataset, go to Sink to set up the destination (in this case Azure Data Lake Storage Gen2 (ADLS)) where the data will be copied to. Similar to setting up the Source dataset, we need to set up linked service to ADLS.
For integration runtime, since we are now connecting to Azure services rather than external location, we can select AutoResolveIntegrationRuntime. For Authentication type, let’s select Account Key for now, then select From Azure subscription as Account selection method, then select Azure subscription and storage account name (if there’s no stroage account name available, you will have to create a storage account in the Azure Portal.)

You will be asked to specify the file path to store the data in the ADLS. For this purpose, you will need to create a container in the storage account to store the data. (I have first created a container named “supermarket-sales”.)

As a good practice, it is also recommended that you maintain a hierachical structure in our ADLS for better organization. As such, I have created a folder called “raw-data” to store the raw data that is copied directly from the On-premise SQL Server such that I know this folder contains data that is before any transformation.

After setting up the storage account and folder, you should now be able to select the folder for the Sink Dataset in ADF.

After setting both Source and Sink dataset, you should now be able to validate and publish the pipeline. Afterward, you may click “Add trigger” and “Trigger now” to execute the pipeline.

2.2.1 Set up Key Vault (Optional)
Go to Azure Portal and search for Key Vaults, and create a key vault.

Afterward, click the key vaults created just now, go to Setting -> Access configuration and set permission model to “Vault access policy”. (Note: It is possible to use Azure role-based access control for ADF, but this permission model is currently not supported in Azure Databricks which we will be using to perform data transformation at later stage, so I have decided to choose vault access policy for this project so that i can keep all secrets within the same key vaults. Alternatively, you can create separate key vault instance for ADF and and Azure Databricks.)

Then go to “Access policies” and click “Create” to create an access policy for ADF.

Select the ADF instance by typing the ADF name (in my case “louis-adf-2024”), then go to “Review + create” and click “Create”.

Now, we have created an access policy for our ADF, so we can start generating the secret. Go to “Secret” and click “Generate/Import” to generate a secret. Asign a name which will be used as the reference to this secret, and enter the SQL Authentication user password as “Secret Value”. Once generated the secret, we can use the secret name as the reference to access the secret value in other Azure services.

2.2.2: Copy multiple tables
In the above section, I have demonstrated how to copy a single table from on-premise SQL Server to ADLS. In case there are multiple tables, one may have to add the “Copy data” activity into the pipeline, which can be cumbersome if there are many tables that needs to be copied. Therefore, this section will show you how to copy multiple tables using “Lookup” and “For each”.
Firstly, drag “Lookup” activity into the pipeline and create new source dataset. For Linked service, we need to choose the self-hosted linked service that can connect to our on-premise SQL server (you can follow previous section on how to set up self-hosted linked service). For table name, we will leave it as blank here as we will input it dynamically later. Click “OK” to create the dataset.

Afterward, choose “Query” for “Use query” and insert the code below to extract the SchemaName and TableName from the on-premise SQL Server Database.
SELECT
  s.name AS SchemaName,
  t.name AS TableName
FROM sys.tables t
INNER JOIN sys.schemas s
ON t.schema_id = s.schema_id
WHERE s.name = '<schema_name>'

Then we can click “Debug” to trigger a test run of the pipeline. When the run is succeeded, we can click the blank area in the pipeline and then view the output of the lookup activity. You will notice that the output is in json format and there is a key “value” which contains the actual output value (in this case “SchemaName” and “TableName”) that we want to pass on to the next activity.

Then we can search for “ForEach” activity and drag to the pipeline, and connect the Lookup activity (On Success) to ForEach activity. Then go to ForEach->Settings->Items, click “Add dynamic content” and add @activity('Lookup_tablename').output.value. This will allow the ForEach activity to take the output value array as the iterator for the For-Each loop (e.g., if we have two tables hence two set of output values, the pipeline will perform the activity twice.)

Then go to “Activities” tab within ForEach to add activities with the ForEach activity. It will bring us to a blank page, which is effectively the pipeline embedding within the ForEach activity. Drag “Copy data” to the pipeline. Similar to copying single table, we need to specify the source dataset, which will be the on-premise sql server database we created just now. Then select “Query” for User query and add the following query: @{concat('Select * FROM ', item().SchemaName, '.', item().TableName)}

Afterward, we need to specify the Sink dataset. Let’s create a new dataset and select Azure Data Lake Storage Gen2 as well as the data format like before. (For demonstration purpose, I will select a different format (i.e., json) this time.) Then we need to select the linked service and file path like before. (For demonstration purpose, I have created a separate folder within the ADLS container to store the files generated from this pipeline.)

As you can see in the above screencap, we still have not specify the file name in the file path. This is because we need to insert the file path dynammically, otherwise the pipeline will save each table under the same filename, which will effectively overwrite the preceeding table each time. To do so, we need to click “Open” next to the sink dataset, go to “Parameters” and add a new parameter (say “tablename”) with string Type no default value.

Now, when you go back to the Copy data activity, you should see the parameters appear under the Sink dataset. In this case, we can add dynamic content and insert item().TableName which is the output values from the Lookup activity.

Then open the sink dataset again and add dynamic content to the file name in File path. Then insert the following code @{concat(dataset().<parameter name>, '.<format>')} (in my case, it will be @{concat(dataset().tablename,'.json')})

Now we have configured everything and is ready to trigger the pipeline. As you can see below, the table in json format is successfully copied to our ADLS.

3. Data Transformation
3.1 Microsoft Entra ID
In this section, I will use Azure Databricks to perform data transformation. Before jumping to Azure Databricsk, we first need to create Microsoft Entra ID as we will need it to connect our ADLS to the Azure Databricks Workspace that we will be using later in this section. To do that, we can go to the Azure Portal and search for “Microsoft Entra ID”, then go to “App registrations and add a new registration. You will need to specify the name for the application, whilst you can use the default option for the remaining setting.

After creating the app registration, click the registration that you created in “App registrations” page and it will bring you to the overview of the registration. At this point, we need to copy the following information and save it somewhere as they will be required later.
- Application (client) ID
- Directory (tenant) ID
For this project, I have created secrets in Key Vault so that I can call the secret in Azure Databricks later. (You may refer to section 2.2.1 on how to create a secret in Key Vault.)

Afterward, go to “Certificates & secrets”, click “Client secrets” and create a new client secret. Then, copy the client secret value as we will be using it later.

Lastly, we need to head to our storage account - Access Control (IAM) and click “Add role assignment” to grant “Storage Blob Data Contributor” role to the App that we just created.

Now, we are ready to create an Azure Databricks Workspace!
3.2 Azure Databricks
3.2.1 Create Workspace
Search “Azure Databricks” in the Azure Portal and click “Create”. As usual, Azure requires to fill in the subcription, resource group as well as the pricing tier (I selected Premium tier in this project as there’s a setting in Azure Databricks later on which is only available in Premium tier). After setting up the workspace, you should be able to launch the workspace.

3.2.2 Create compute cluster
Once launching the Azure Databricks Workspace, you will need to create a compute cluster in order to run the notebook in Databricks. To do so, you can click “Compute” in the toggle navigation and then click “create compute”. Then you need to select the details for the setup.
You may refer to the screencap below for my setup, but you may select different options depending on your use case. Most importantly, please remember to check “Enable credential passthrough for user-level data access” under Advanced options (this option is only available if you have selected Premium tier when creating Azure Databricks Workspace in Azure Portal.)

3.2.3 Create Secret Scope
One more thing to do before jumping to the notebook is that we need to create a Databricks secret scope to store the access key to our Azure Data Lake Storage, so that we can avoid directly inputting the key into our notebook. In order to do so, we can copy the current url up to # and then add secrets/createScope. In my case, it looks something like “https://adb-4437882643571537.17.azuredatabricks.net/?o=4437882643571537#secrets/createScope”

After that, you will be prompted to enter Scope Name as well as the Azure Key Vault DNS Name and Resource ID. For Azure Key Vault DNS Name and Resource ID, you can find it in Azure Key Vault’s Properties page (DNS Name = Vault URI and Resource ID = Resource ID) . Once created, we will be able to use the scope name in the notebook to access the secrets we have created in our Azure Key Vault. (I have created secret scope with scope name “louis-key-supermarket”)


3.2.4 Create Notebook
Now, we can proceed to creating a new notebook and try to call the secret that we created just now. Beforehand, I have already created another secret in Azure Key Vault to store the access key to our ADLS. You can use the following code to view/get the secret available:
dbutils.secrets.listScopes(): List out existing secret scopesdbutils.secrets.list(scope="<scope name>"): List out existing secrets within secret scope (i.e., the secrets we have created in Azure Key Vault)dbutils.secrets.get(scope='<scope name>', key='<secret name>'): # Get the secret content from Azure Key Vault
In order to let Azure Databricks to read the file in our ADLS, we need to first get the Microsoft Entra ID’s Application ID, Directory ID and client Secret and insert it into a configs dictionary. Then use the configs to create a mount point to our ADLS location with the following code:
dbutils.fs.mount(
    source = "abfss://<container-name>@<storage-account-name>.dfs.core.windows.net/<path-to-data>"
    mount_point = "/mnt/<storage-account-name>
    extra_configs = configs
)

Now, we can read the raw data csv file in our ADLS and perform data transformation and feature engineering. For this project, I will use PySpark to do the following steps:
- standardize the column name
- convert the date string into date format that is readable by PySpark
- create new columns based on the date column
- select the necessary columns as our final transformed dataframe

Lastly, I will try to move the existing version of transformed data (if any) into a new folder “transformed-data-{current date}” in our ADLS and save the new transformed data as csv file in a folder called “transformed-data-latest”. By doing so, we retain the previous version of the transformed data whilst ensuring the latest version is saved in the “latest” folder.


3.3 Update pipeline in Azure Data Factory
In previous section, we have created the notebook in Azure Databricks, so now we need add an activity in our ADF such that the notebook can be executed once the pipeline is triggered.
3.3.1 Databricks Notebook Activity
As a first step, we need to generate an access token in Azure Databricks so that our ADF can access the Databricks notebook. Let’s go to Azure Databricks, click on the user logo on the top right corner > settings. Then Select “Developer” and click “Manage” in the Access tokens section. Then click “Generate new token” to generate the token (note that you have to copy the token and save it somewhere as you will not see it again. Otherwise, you will have to generate a new token.)

Now we can go back to ADF studio and add a new linked service to connect our ADF to Azure Databricks. To do so, we can go to Azure Data Factory studio > Manage > Linked Services, then click “+ New” and search for Azure Databricks under “Compute”.

Here we can select AutoResolveIntegrationRuntime as we are connecting to an Azure service, and select the azure subscription and databricks workspace that we created. For cluster, we can select “existing interactive cluster” to use our existing cluster. For Authentication type, we can select Access Token and then enter the access token either manually or through Azure Key vault.

Now we can go back to our pipeline, search for Databricks, add the Notebook activity into the pipeline and connect our Data Transfer activity (on success) to the Databricks Notebook activity. In the activity, we need to specify the linked service that we just created and the path of our notebook (which can be checked in Azure Databricks). Once finished, this activity is ready.
3.3.2 Rename transformed data
Before we can move on, you may recall that the filename of our transformed data is auto-generated and it contains a very long string. For better organization, we should rename the file to something that is understandable so that we can refer back to it more easily in subsequent step. Unfortunately, there is no direct way to write the csv file with specific name in Databricks, so we need to do it in ADF.
Now, let’s add the “Get Metadata” activity to the ADF pipeline and connect the Databricks Notebook activity (on success) to the “Get Metadata” activity. Go to Settings of “Get Metadata” activity and create a Dataset that links to our ADLS Gen2. For data format, we can select Binary given that we just need to get the table name. For properties, we can select the WorkspaceDefaultStorage for link service and AutoResolveIntegrationRuntime for runtime. For File path, we can select the “transformed-data-latest” folder and we will insert the file name later dynamically.

After adding the dataset, click “+ New” next to Field list and select Child items to get the file names of the items stored within the “transformed-data-latest” folder.

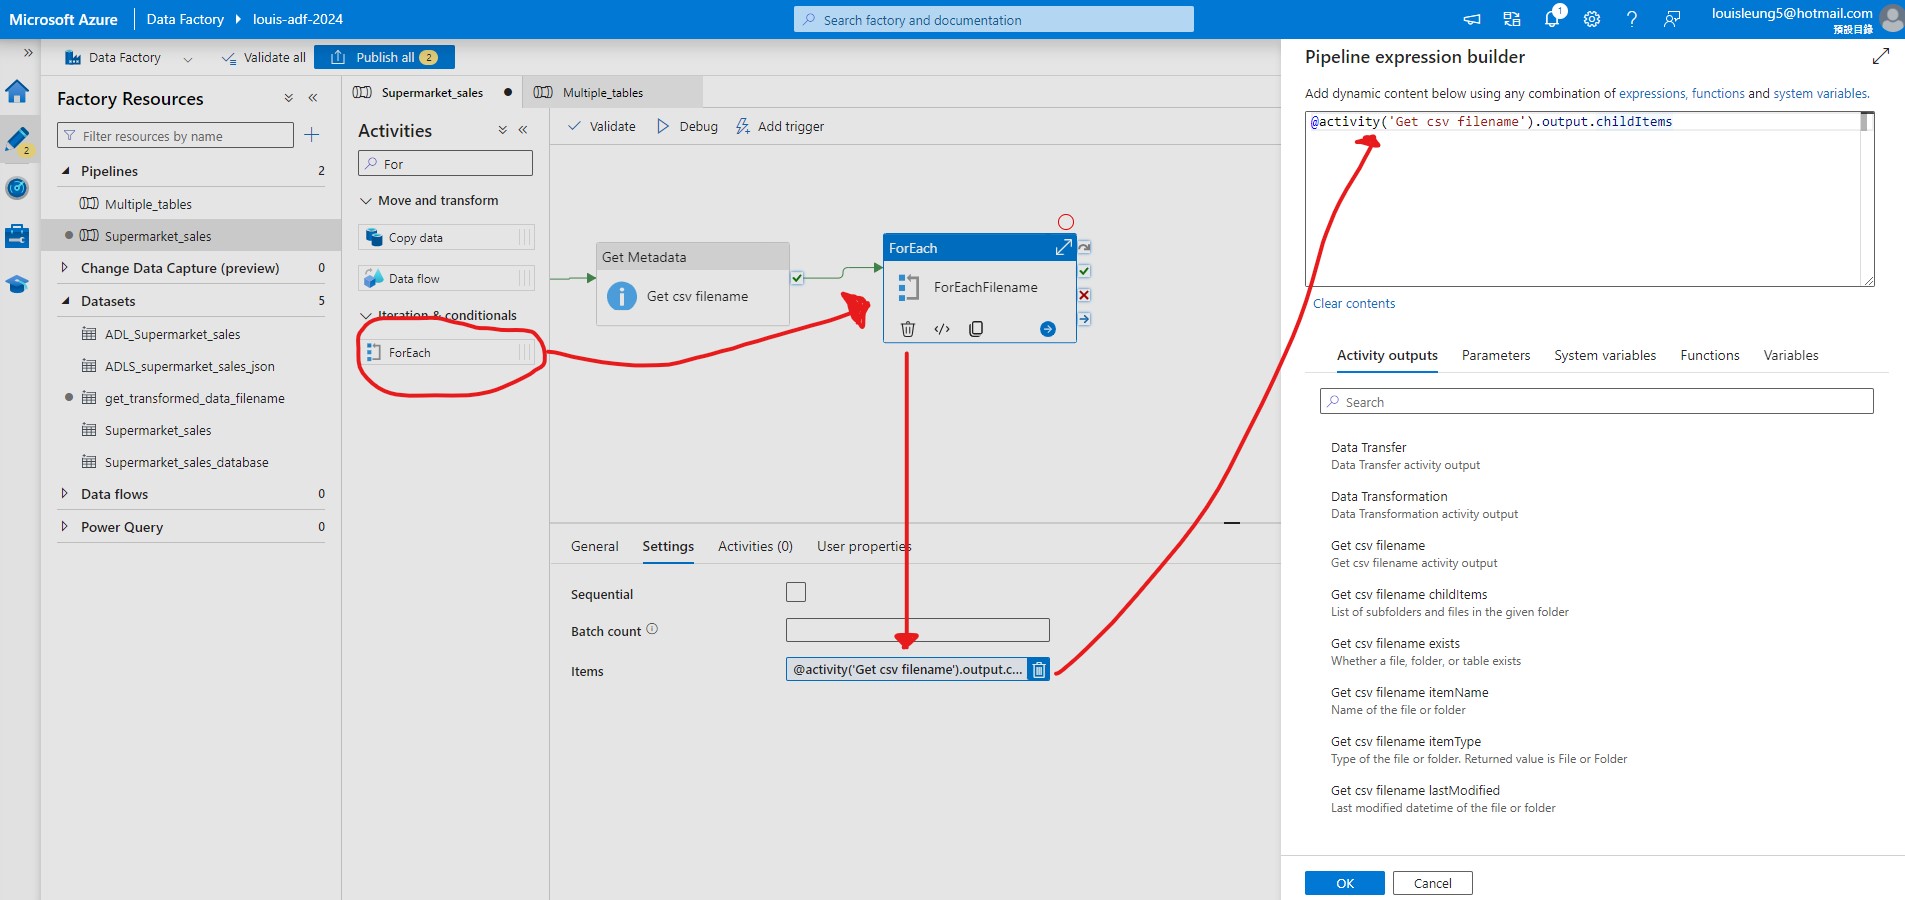
Now we need to add a ForEach activity (which works for single table or multiple tables) and connect the “Get Metadata” activity (on success) to the “ForEach” activity. In the Settings, we need to add dynmaic content to the Items and insert @activity('<name of Get Metadata activity>').output.childItems. This allows us to use the item names one-by-one from the “Get Metadata” activity as the input of each iteration of the “ForEach” loop.
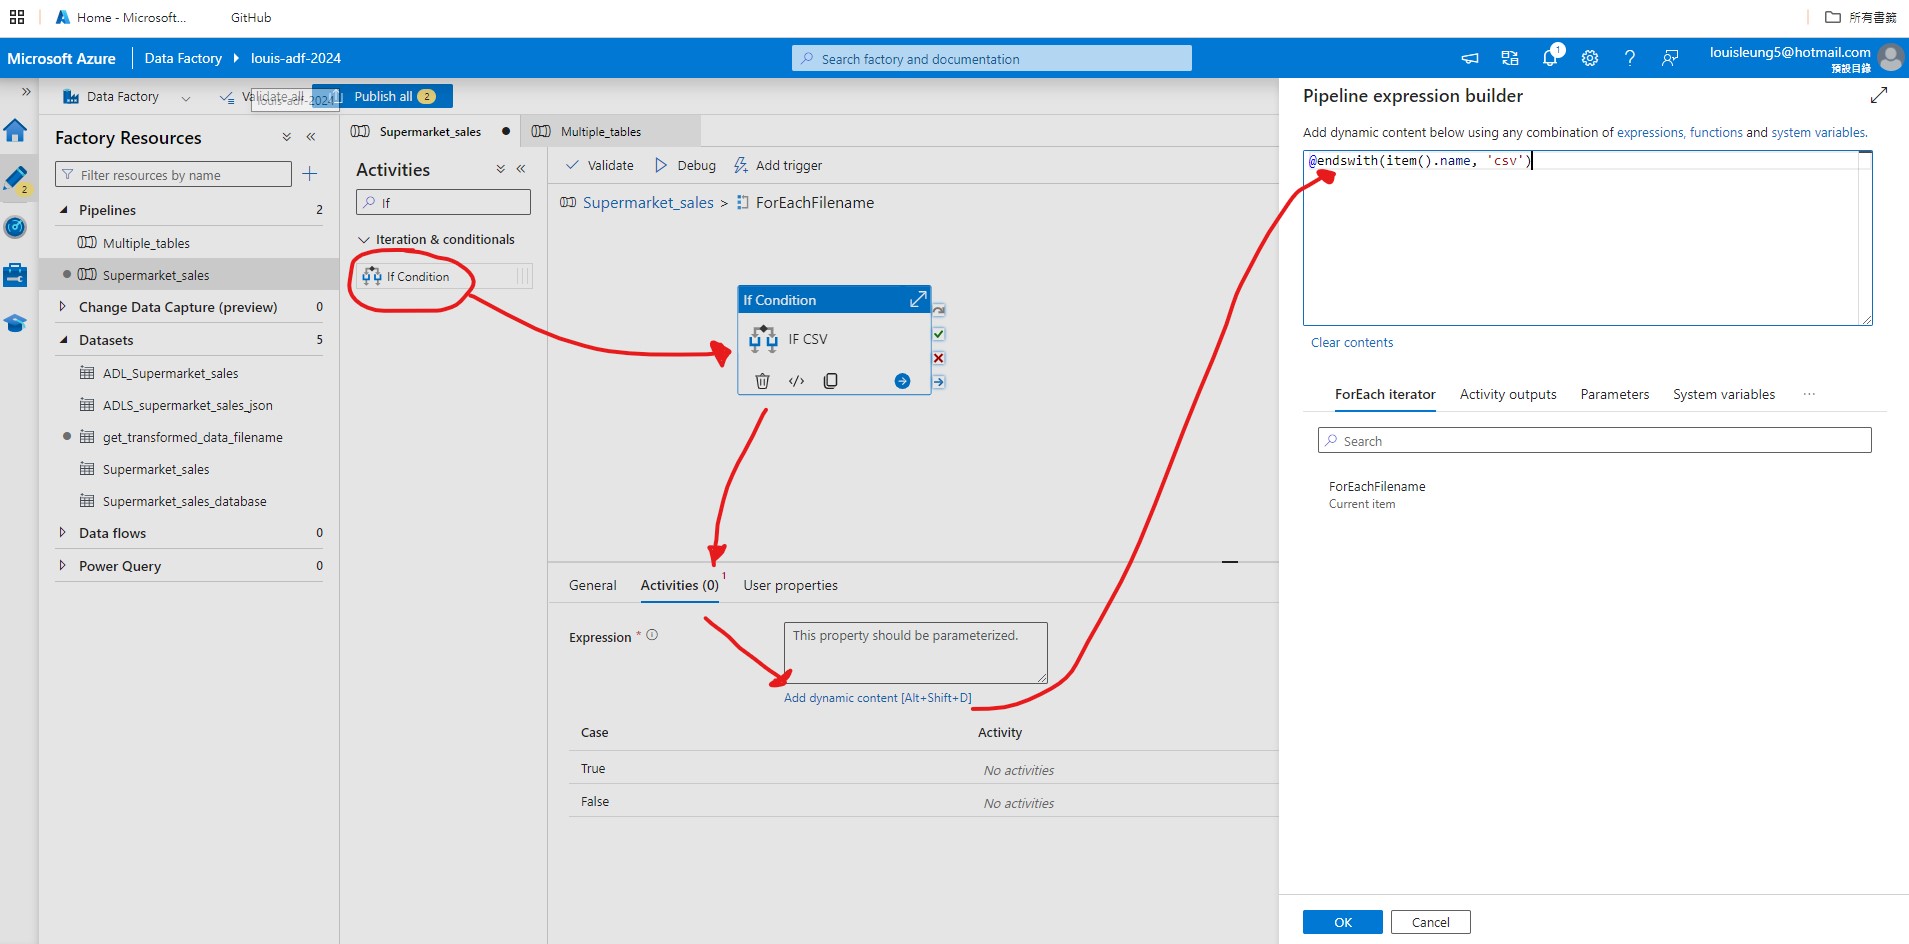
Then go inside the “ForEach” activity and add “If Condition” activity, select the “If Condition” activity, goes to Activities section and enter @endswith(item().name, '.csv'). This will filter the file names and only file name that ends with “.csv” will be processed.
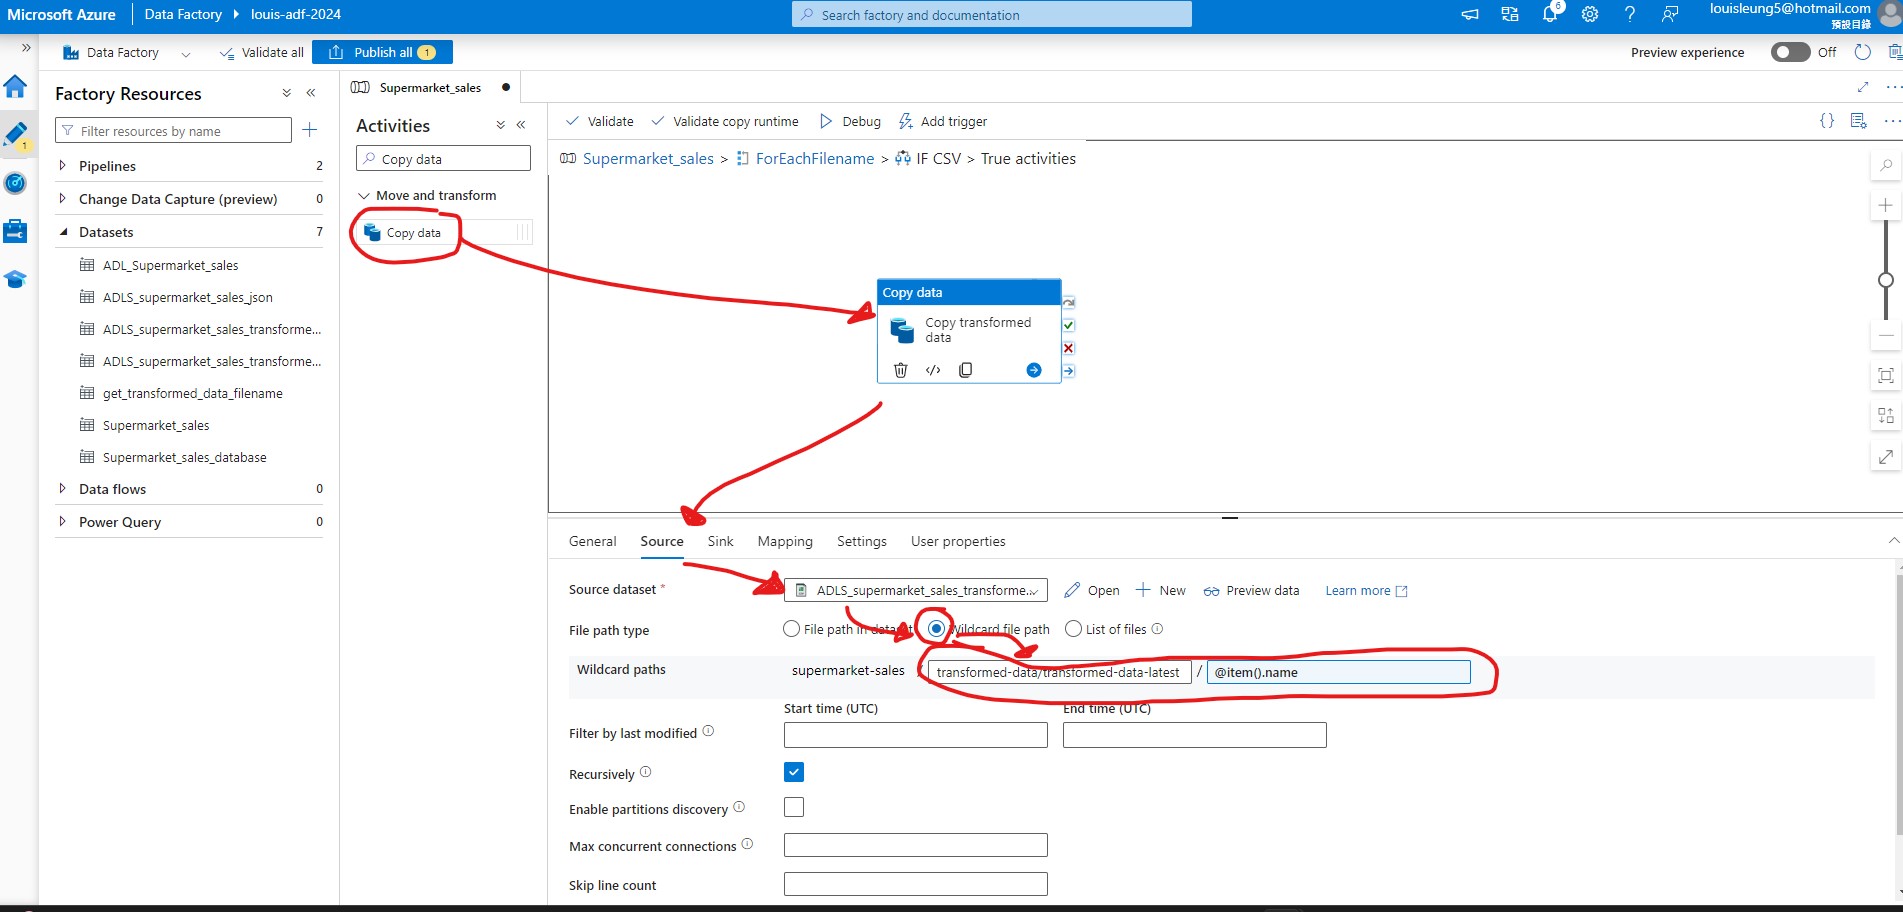
Then go inside the “If Condition” activity and add “Copy data” activity to the “True” section so that the “Copy data” activity will only be triggered when there is a csv file. For Source dataset, create a new csv dataset that links to ADLS Gen2 > “Transformed-data-latest” folder without specifing the file name just yet. Then select “Wildcard file path” as the file path type, then add the link to the “Transformed-data-latest” path to Wildcard folder path and add @item().name to filename.
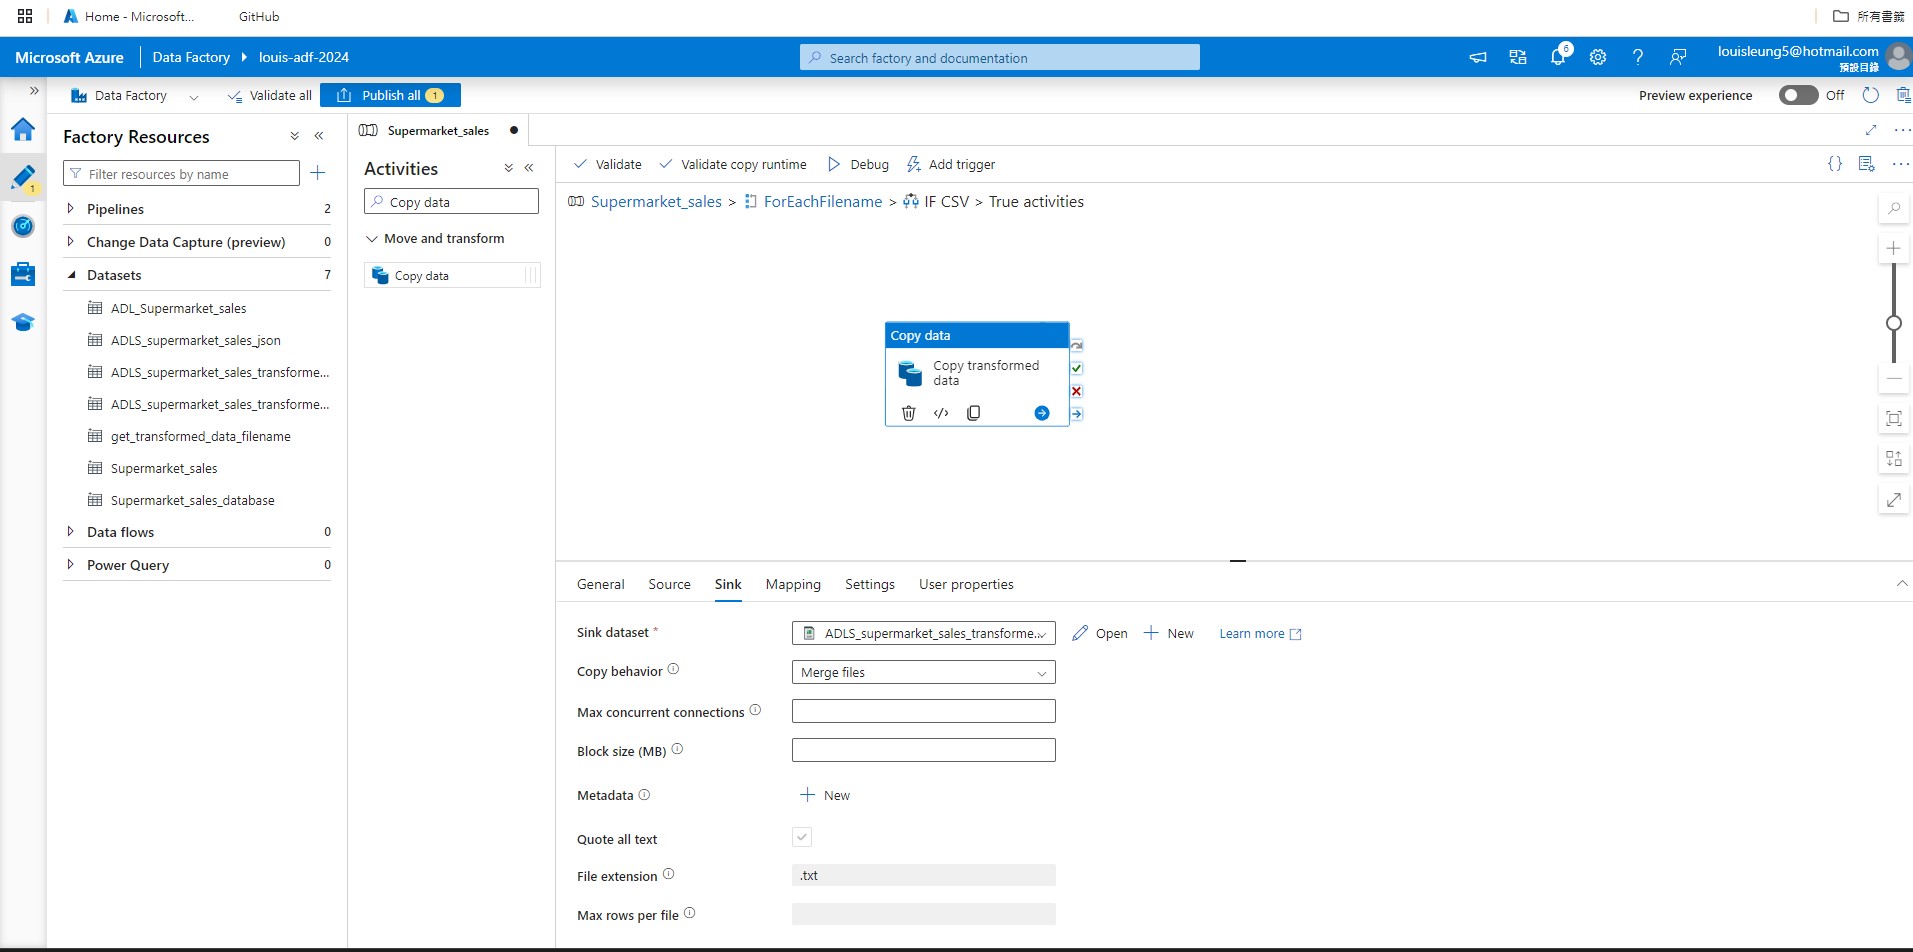
For Sink dataset, create a new csv dataset that links to ADLS Gen2 > “Transformed-data-latest” folder but this time we specify the data as “Transformed-data.csv” such that the output file will be saved with this filename. Then select “Merge files” for copy behavior.
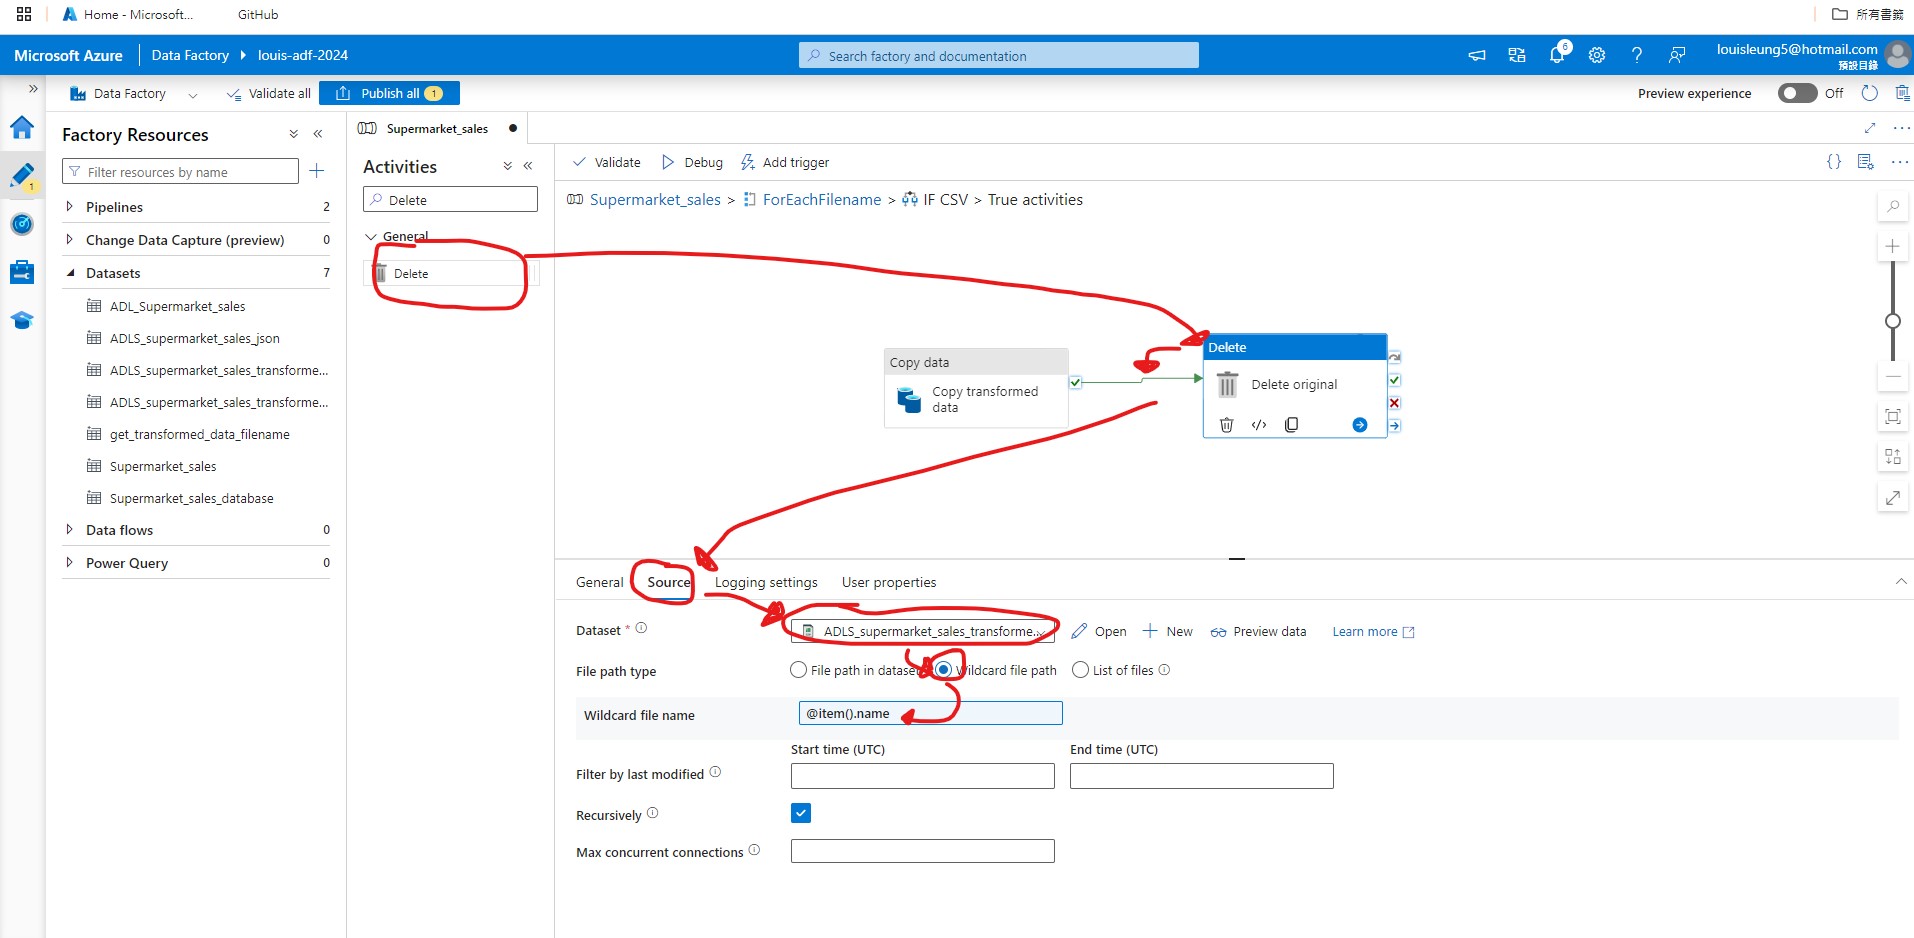
After configuring the copy data activity, we need to add a “Delete” activity to delete the original file. Let’s search for “Delete” activities and drag it next to the “Copy data” activity that we just used, then connect “Copy data” activity (on success) to the “Delete” activity. For Source within “Delete” activity, we can use the same source dataset as our “Copy data” activity and use @item().name as the Wildcard file name.
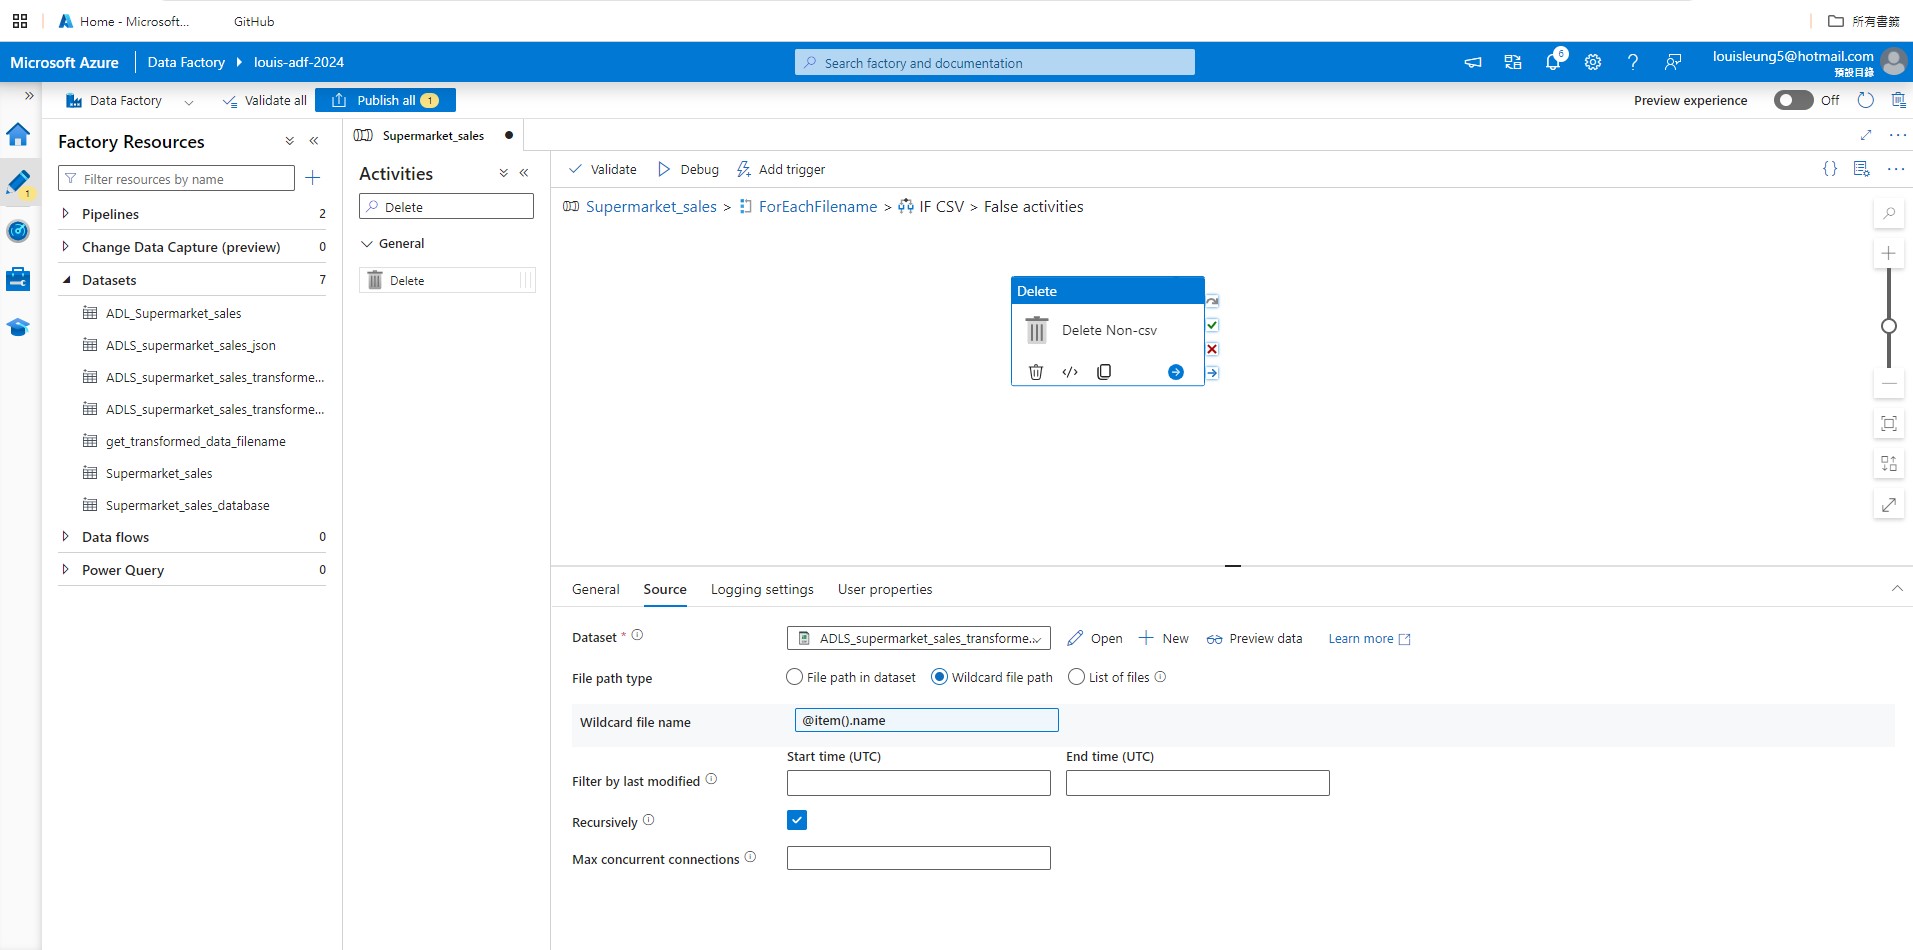
We have finished configuring the True section of the “If Condition” activity, so now we need to add “Delete” activity to the False section such that it will delete all non-csv files in the “Transformed-data-latest” folder. Similar to before, go inside the False section, drag “Delete” activity to the pipeline, then use the same source dataset as the “Delete” activity in the True section and use @item().name as the Wildcard file name.
The data tranformation process is almost done, and now we just need to add a scheduled trigger so that the pipeline will automatically run after a specified time interval. To do so, click “Add trigger > New/Edit” above the pipeline and add a new trigger. For type, we can select “Schedule” and then select the appropriate start date, time zone and timeframe for recurrence. After that, click “OK” to create the trigger.

Now we are ready to proceed to the next step - data loading.
4. Data Loading
In this section, we will perform the data loading using Azure Synapse Analytics.
4.1 Create Synapse workspace
Firstly, we need to create a new Synapse workspace in Azure Synapse Analytics. To do so, we can search Azure Synapse Analytics in our Azure Portal. Once entered into the service, we can click “+ Create” to create the workspace, which requires us to specify the subscription, resource group as well as the Data Lake Storage Gen2 (we just need to select those that we have been using for this project). For other configurations, you may use the default options.
After creating the workspace, we can click “Open” to open the Synapse Studio.

4.2 Create Serverless SQL Database
Once entered the Synapse Studio, go to Data section and create a SQL database (I’m going to name it “supermarket_sales_sql”). Here, we need to select SQL pool type. Typically, serverless sql has a dynamic resource allocation and charge based on the volume of usuage, so it is suitable for ad-hoc and exploratory use; whereas dedicated sql has a fixed resource allocation and hence a more stable performance, so it is more suitable for consistent workloads. In this project, I selected serverless SQL.

After creating creating the SQL database, if we go to “Linked” section, we should be able to see that it will automatically connect to our ADLS Gen2.

Left click at the “transformed-data-latest” folder and select “New SQL script” > “Select TOP 100 rows” > select “Text format” as data type. It will automatically generate a sample script that allows us to query the top 100 rows of our transformed data. Now, we need to copy the OPENROWSET(...) section of the script because that allows us to query the data stored in the “transformed-data-latest” folder.
4.3 Create Stored Proceudre
Now, we need to create a stored procedure to create a view of our serverless SQL database. Let’s open a new script and run the following (note that all single quote needs to be replaced with two consecutive single quotes):
USE <sql database name>
GO

CREATE OR ALTER PROC CREATE_VIEW @ViewName nvarchar(100)
AS
BEGIN

DECLARE @statement VARCHAR(MAX)

SET @statement = concat('CREATE OR ALTER VIEW ', replace(replace(@ViewName, '-','_'), '.','_') + ' AS
    SELECT *
    FROM
        <OPENROWSET(...) section copied from sample script> AS [result]')

EXEC (@statement)

END
GO

4.4 Create Synapse Pipeline
After creating the stored procedure, we need to create a pipeline in our Synapse Analytics to execute the procedure. To do so, we need to create a linked service for our severless sql database. Let’s go to Manage > Linked services, click “+ New” and search for “Azure SQL Database”. As usual, we can select AutoResolveIntegrationRuntime for integration runtime and Recommended for Version. For Account selection method, I am going to select “Enter manually”. The fully qualified domain name can be found by looking at “Serverless SQL endpoint” from the “Properties” page of our synapse analytics resource in the Azure Portal. For Database name, we can enter the database name that we used to create the serverless sql in Synapse Analytics. For Authentication type, I am going to select “System Assigned Managed Identify”.

Now we can the “Integrate” tab and add a new pipeline. In the pipeline, we need to add the “Get Metadata” activity to extract the file name of the csv file stored in the “transformed-data-latest” folder in our ADLS Gen2. Go to the Settings in the Get Metadata activity and click “+ New” to add a Dataset and search for Azure Data Lake Storage Gen2.

For data format, we can select Binary given that we just need to get the table name. For properties, we can select the WorkspaceDefaultStorage for link service and AutoResolveIntegrationRuntime for runtime. For File path, we can select the “transformed-data-latest” folder and we will insert the file name later dynamically.

After adding the dataset, click “+ New” next to Field list and select Child items to get the file names of the items stored within the “transformed-data-latest” folder.

Now we need to add a ForEach activity (which works for single table or multiple tables) and connect the “Get Metadata” activity (on success) to the “ForEach” activity. In the Settings, we need to add dynmaic content to the Items and insert @activity('<name of Get Metadata activity>').output.childItems. This allows us to use the item names one-by-one from the “Get Metadata” activity as the input of each iteration of the “ForEach” loop.

Then go inside the “ForEach” activity and add “If Condition” activity, select the “If Condition” activity, goes to Activities section and enter @endswith(item().name, '.csv'). This will filter the file names and only file name that ends with “.csv” will be processed.
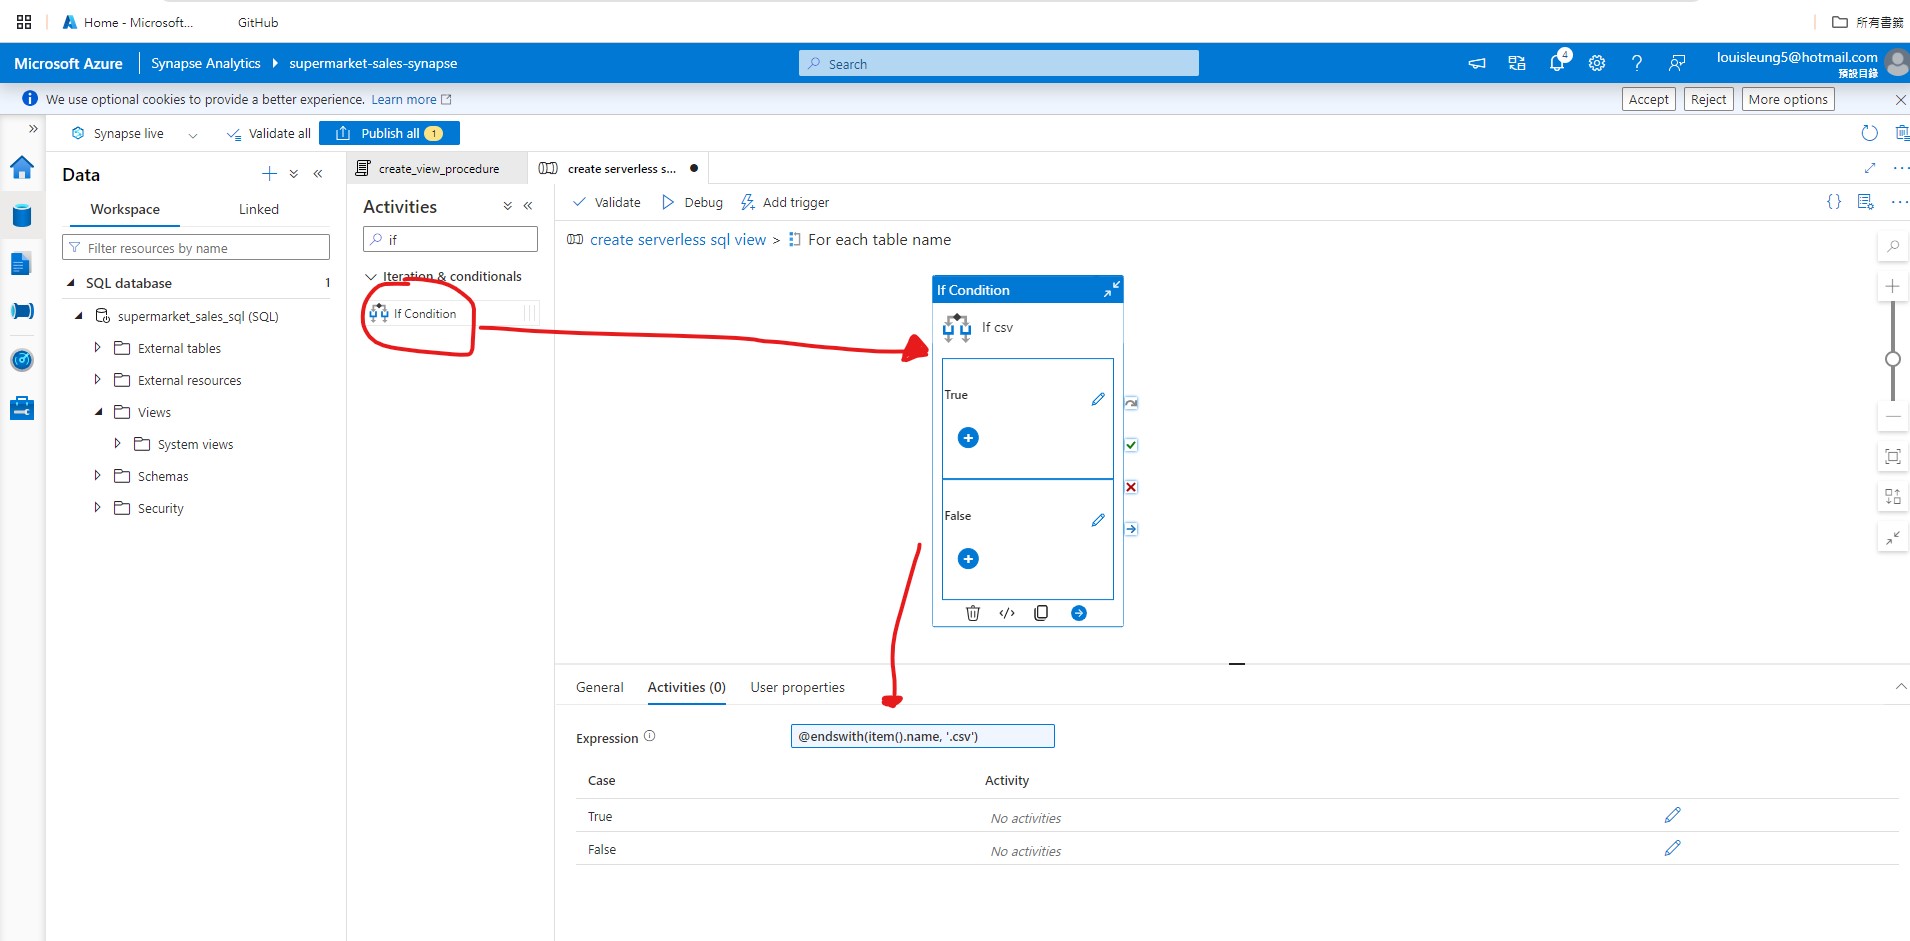
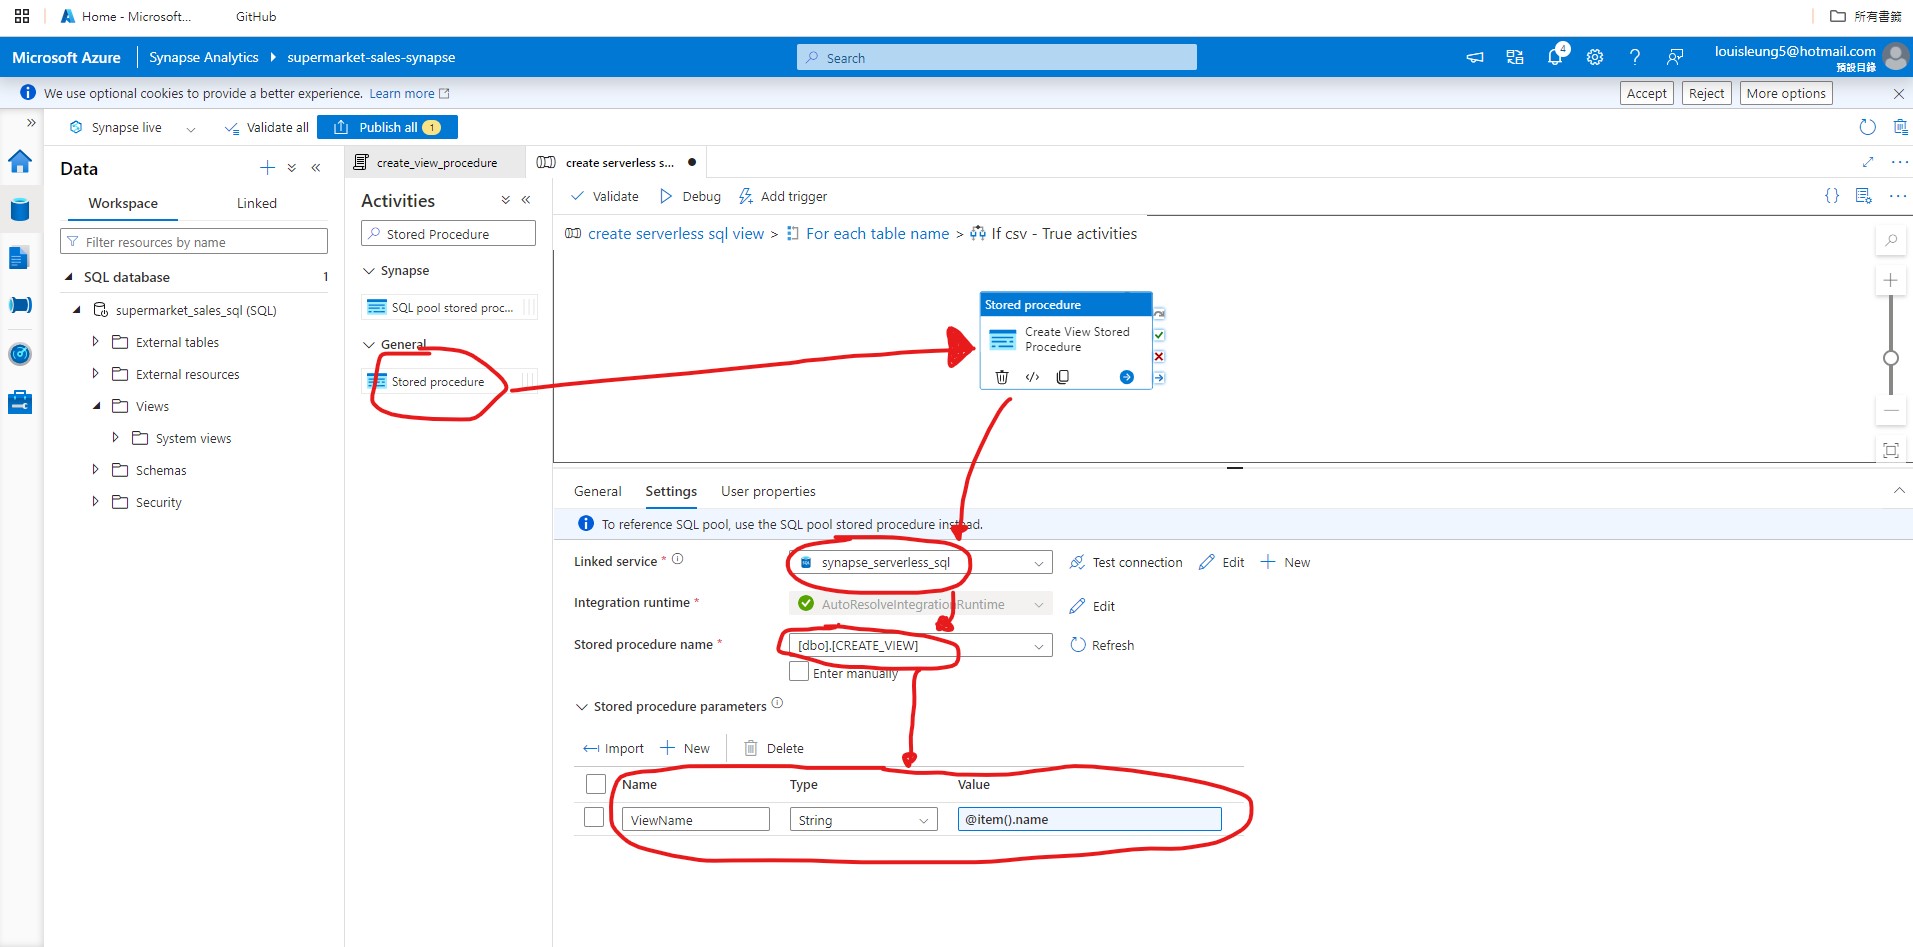
Then go inside the “If Condition” activity and add “Stored Procedure” activity. In the “Stored Procedure” activity’s Settings, select the severless sql linked service and stored procedure that we created step 4.2 and 4.3. Also, we need to add a stored procedure parameters. If you recall from our stored procedure script, it is expecting a parameter called ViewName, so we need to put ViewName as the parameter name with string type. For Value, we need to add dynamic content as @item().name which refers to each of the table names that flow into the ForEach activity.
Now we can add a scheduled trigger similar to ADF pipeline (see section 3.3.2) so that it will automatically run after specific time interval (it is suggested that you set this a few minutes after the ADF pipeline to ensure that the Synapse Analytics pipeline is run based on the latest output from the ADF pipeline).
After that, we have finished setting up the Synapse Analytics and we are ready to publish and run the pipeline.
5. Data Visualization
In the previous sections, we have set up the pipeline in Azure Synapse Analytics to create a sql view of our transformed-data, so now we are ready to import the data into PowerBI for building the dasboard.
5.1 Importing data into PowerBI
Now, let’s open PowerBI and click “Get data > More” and a window will pop up to allow us to select different kinds of data source. Go to Azure, select “Azure Synapse Analytics SQL” and click “Connect”.

After that, we need to insert the Server and Database. For Server, we can refer to the Severless SQL Endpoint which can be found in the Propoerties” page of our Azure Synapse Analytics Resource. The database name would be the name of serverless SQL database that we created in Azure Synapse Analytics. For Data Connectivity mode, let’s select “Import” in which the data will be loaded into and stored in PowerBI.
Then PowerBI may requires you to log in for authentication. We can select Microsoft account and use the same account as our Azure account. Once connected, we should be able to see our transformed data view that we created in Synapse Analytics using the stored procedure. Select the view and click “Transform Data” to load the data into PowerBI and do further transformation as necessary.
5.2 Data Tranformation in PowerBI

As you can see in the below screencap, the original header in the dataset are not being treated as header in PowerBI, so we need to transform the data by going to the “Transform” tab and click “Use First Row as Headers”. After that, head back to the “Home” tab and click “Close & Apply” to apply the transformation step and load the data into PowerBI.

Now we are done with importing and transforming the data in PowerBI and we can now use it for building the dashboard.
5.3 Building Dashboard
I have created a dashboard with three pages:
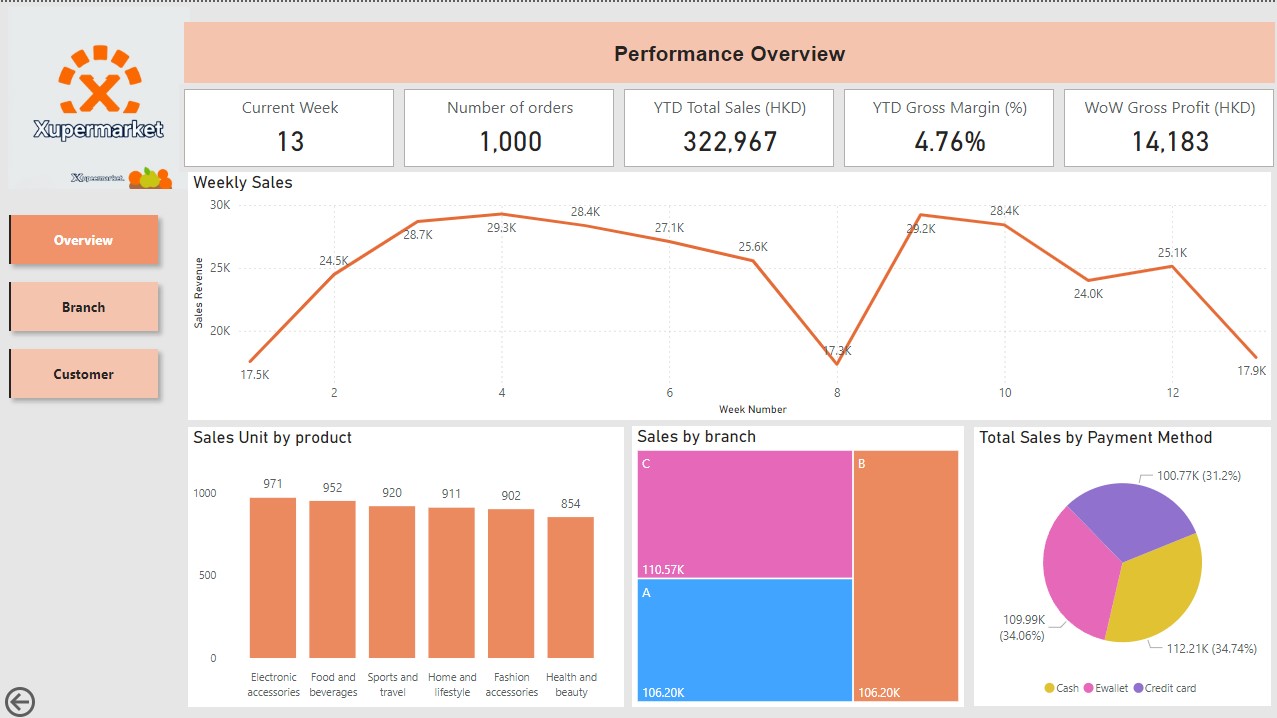
Overview
The Overview pages provide a quick summary of the supermarket’s overall performance including key metrics such as number of orders, YTD total sales, gross margin and week on week gross profit. I have also included some charts to show the sales from different aspects.
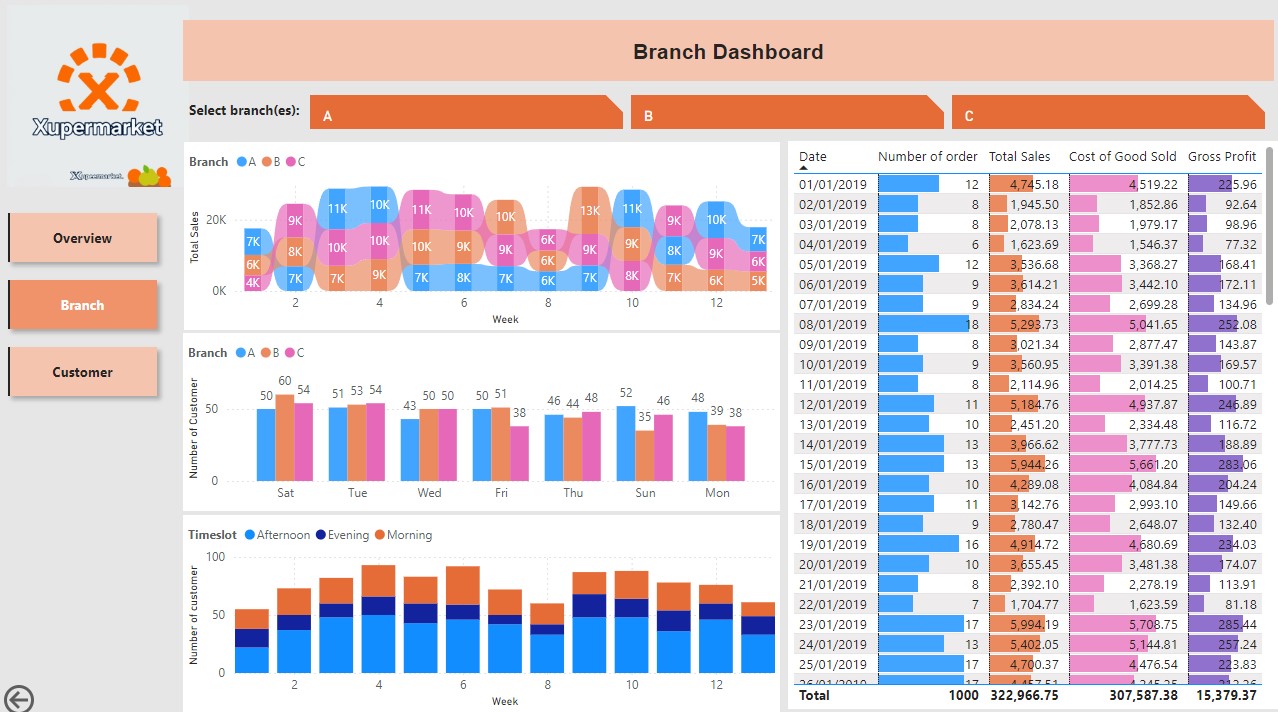
Branch
The Branch page focuses on branch specific performance in which the user can select one or more branches and the other visuals in the page will automatically filter the data based on the selected branches.
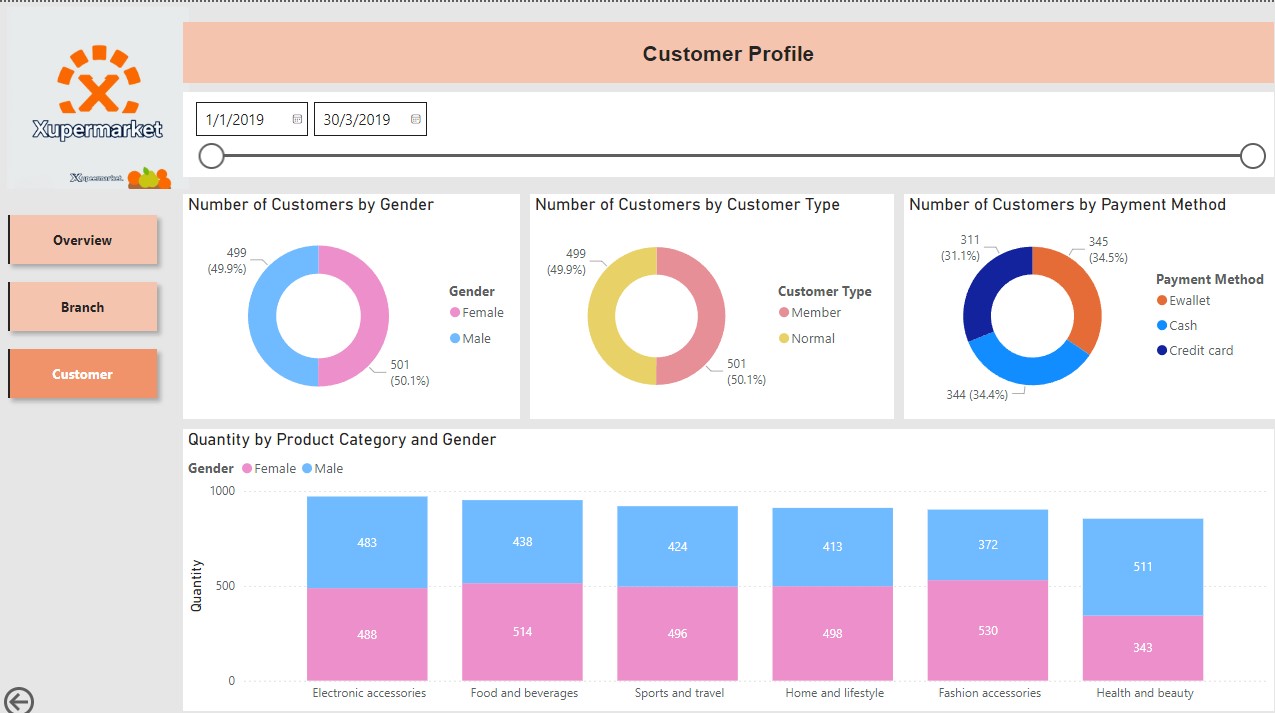
Customer
The Customer page focuses on showing the proportion of customers by gender, customer type, payment method.